Image: Lindsay Bremner
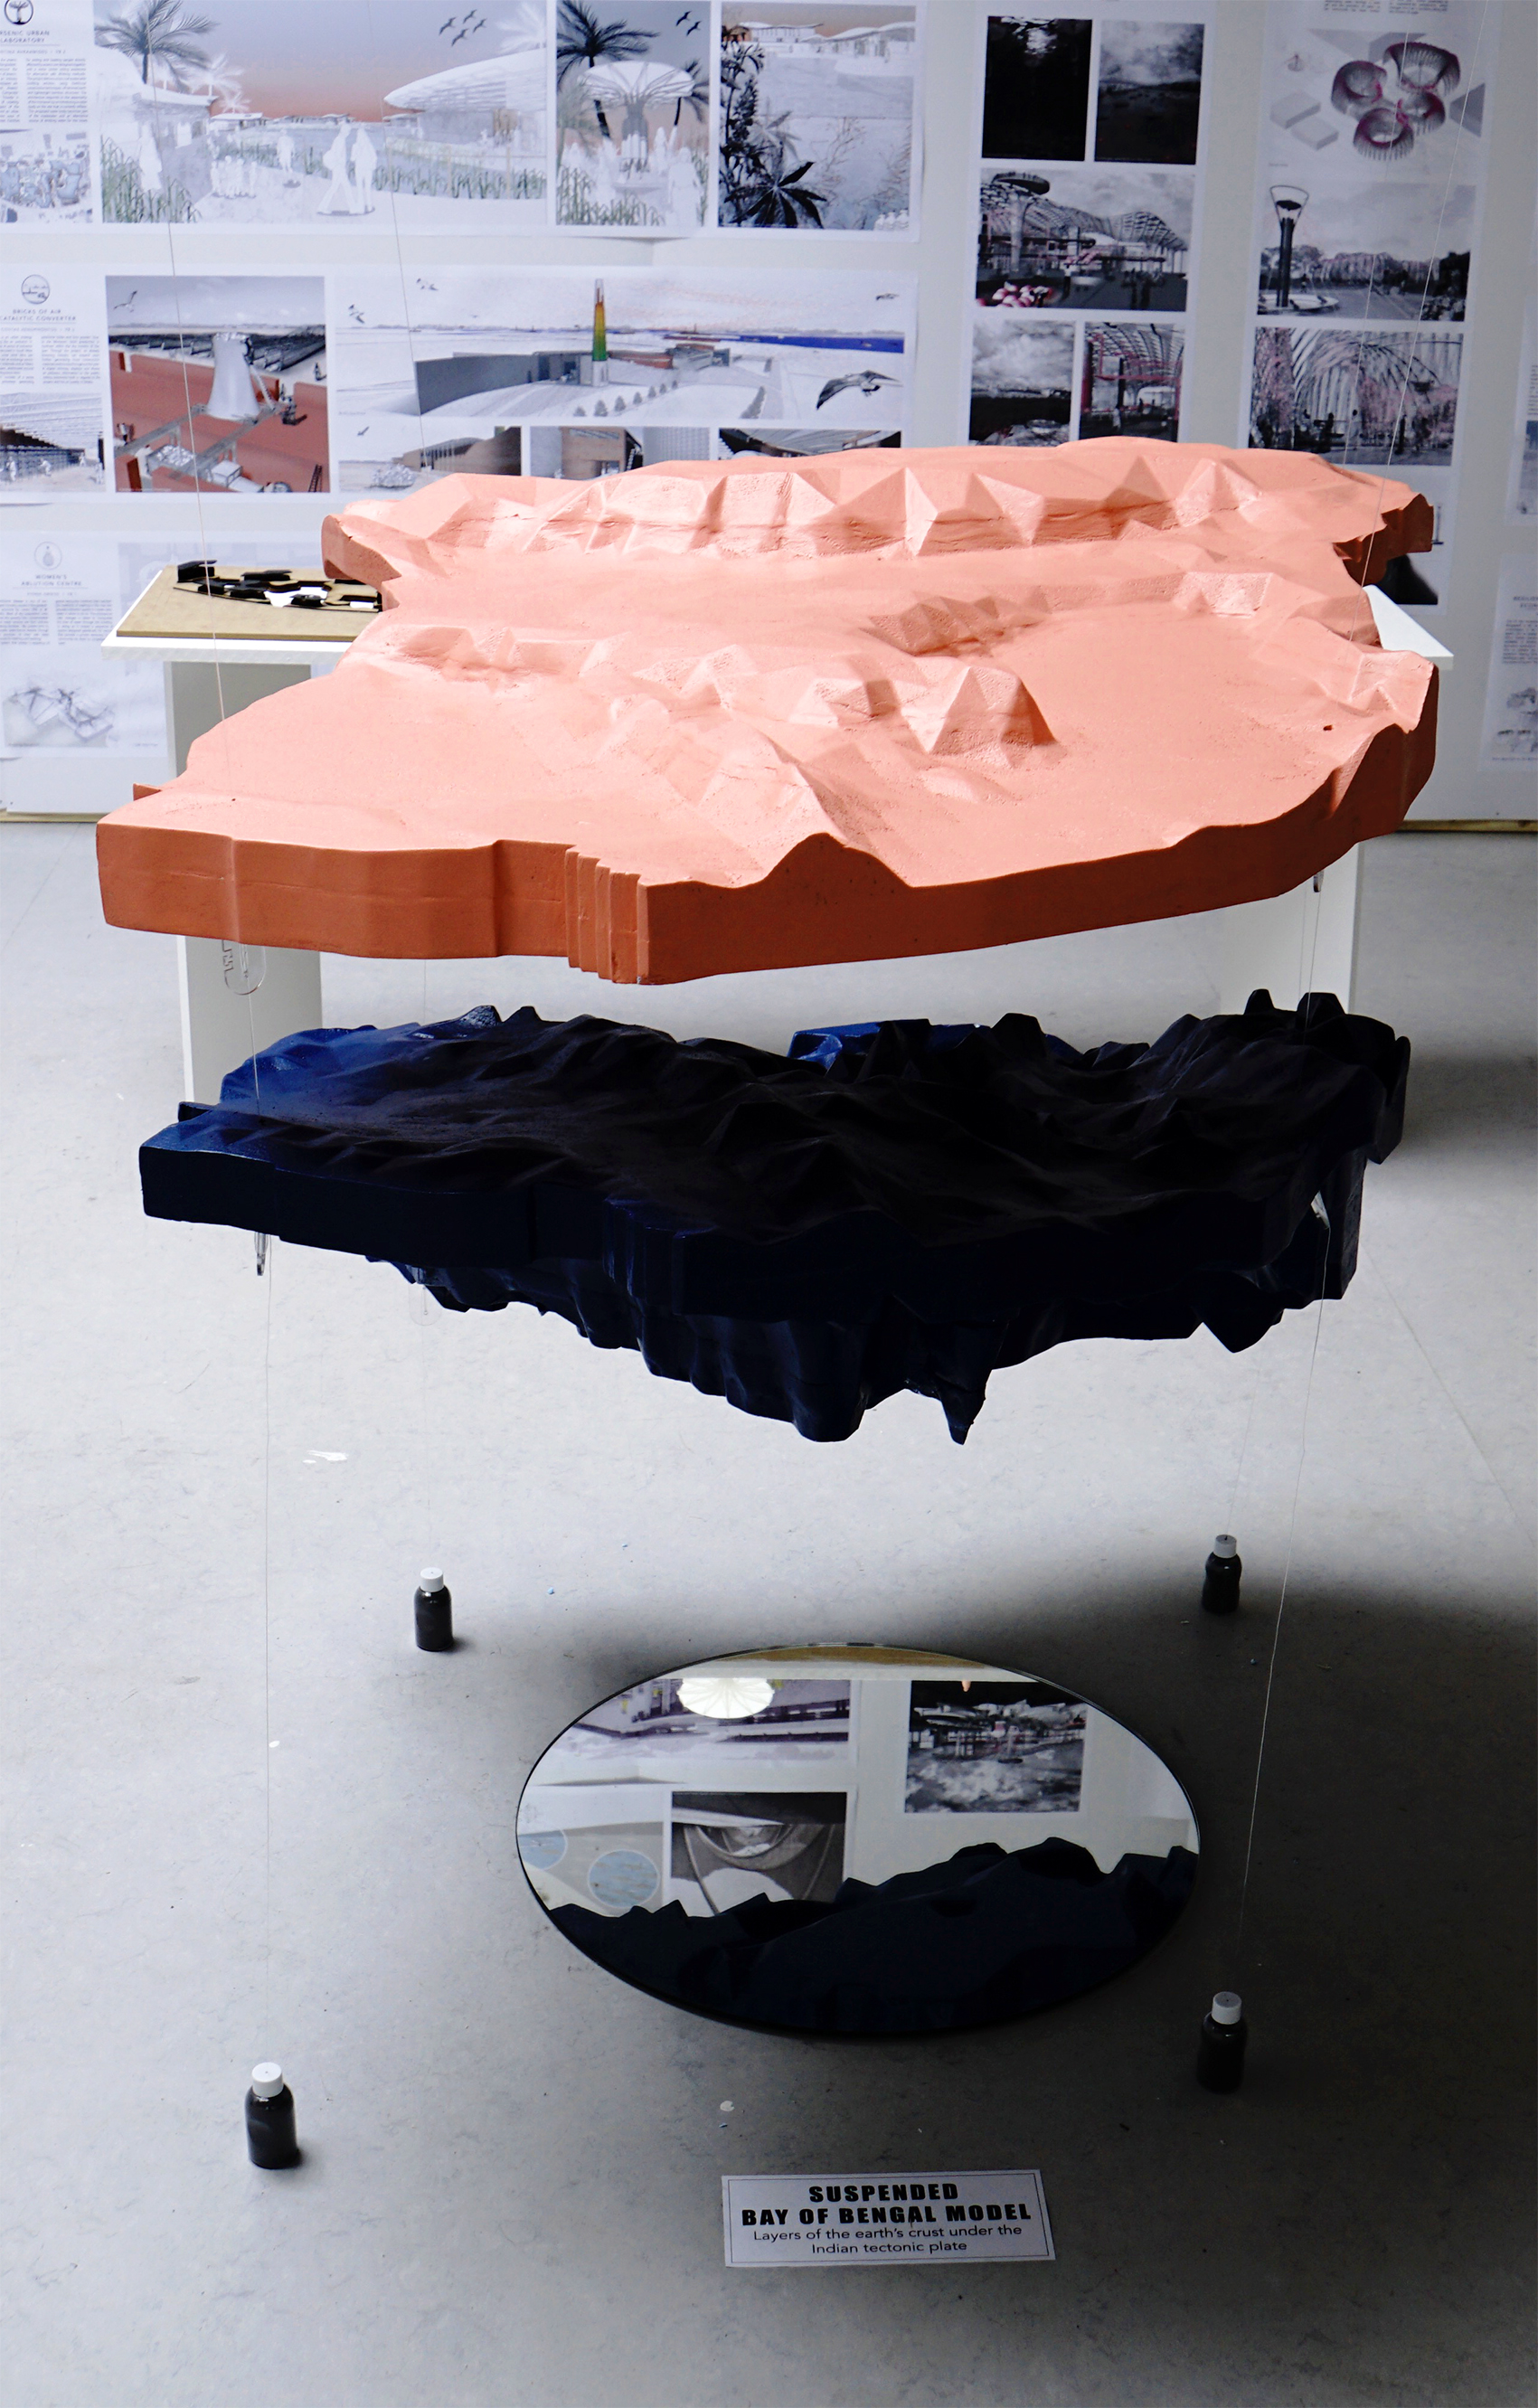
In front of a laser cut topographic model of Bangladesh on the DS18 exhibition that opened last week at the University of Westminster is a rather strange object. It is made up of two profiled CNC foam layers, approximately 150 mm thick, one painted pink and one blue, suspended one over the other on thin fishing wire with a gap ranging from approximately 150 – 500 mm between them. The top one is triangulated, more or less flat, but with a linear ridge along one edge, the underneath one dips markedly towards the same side.
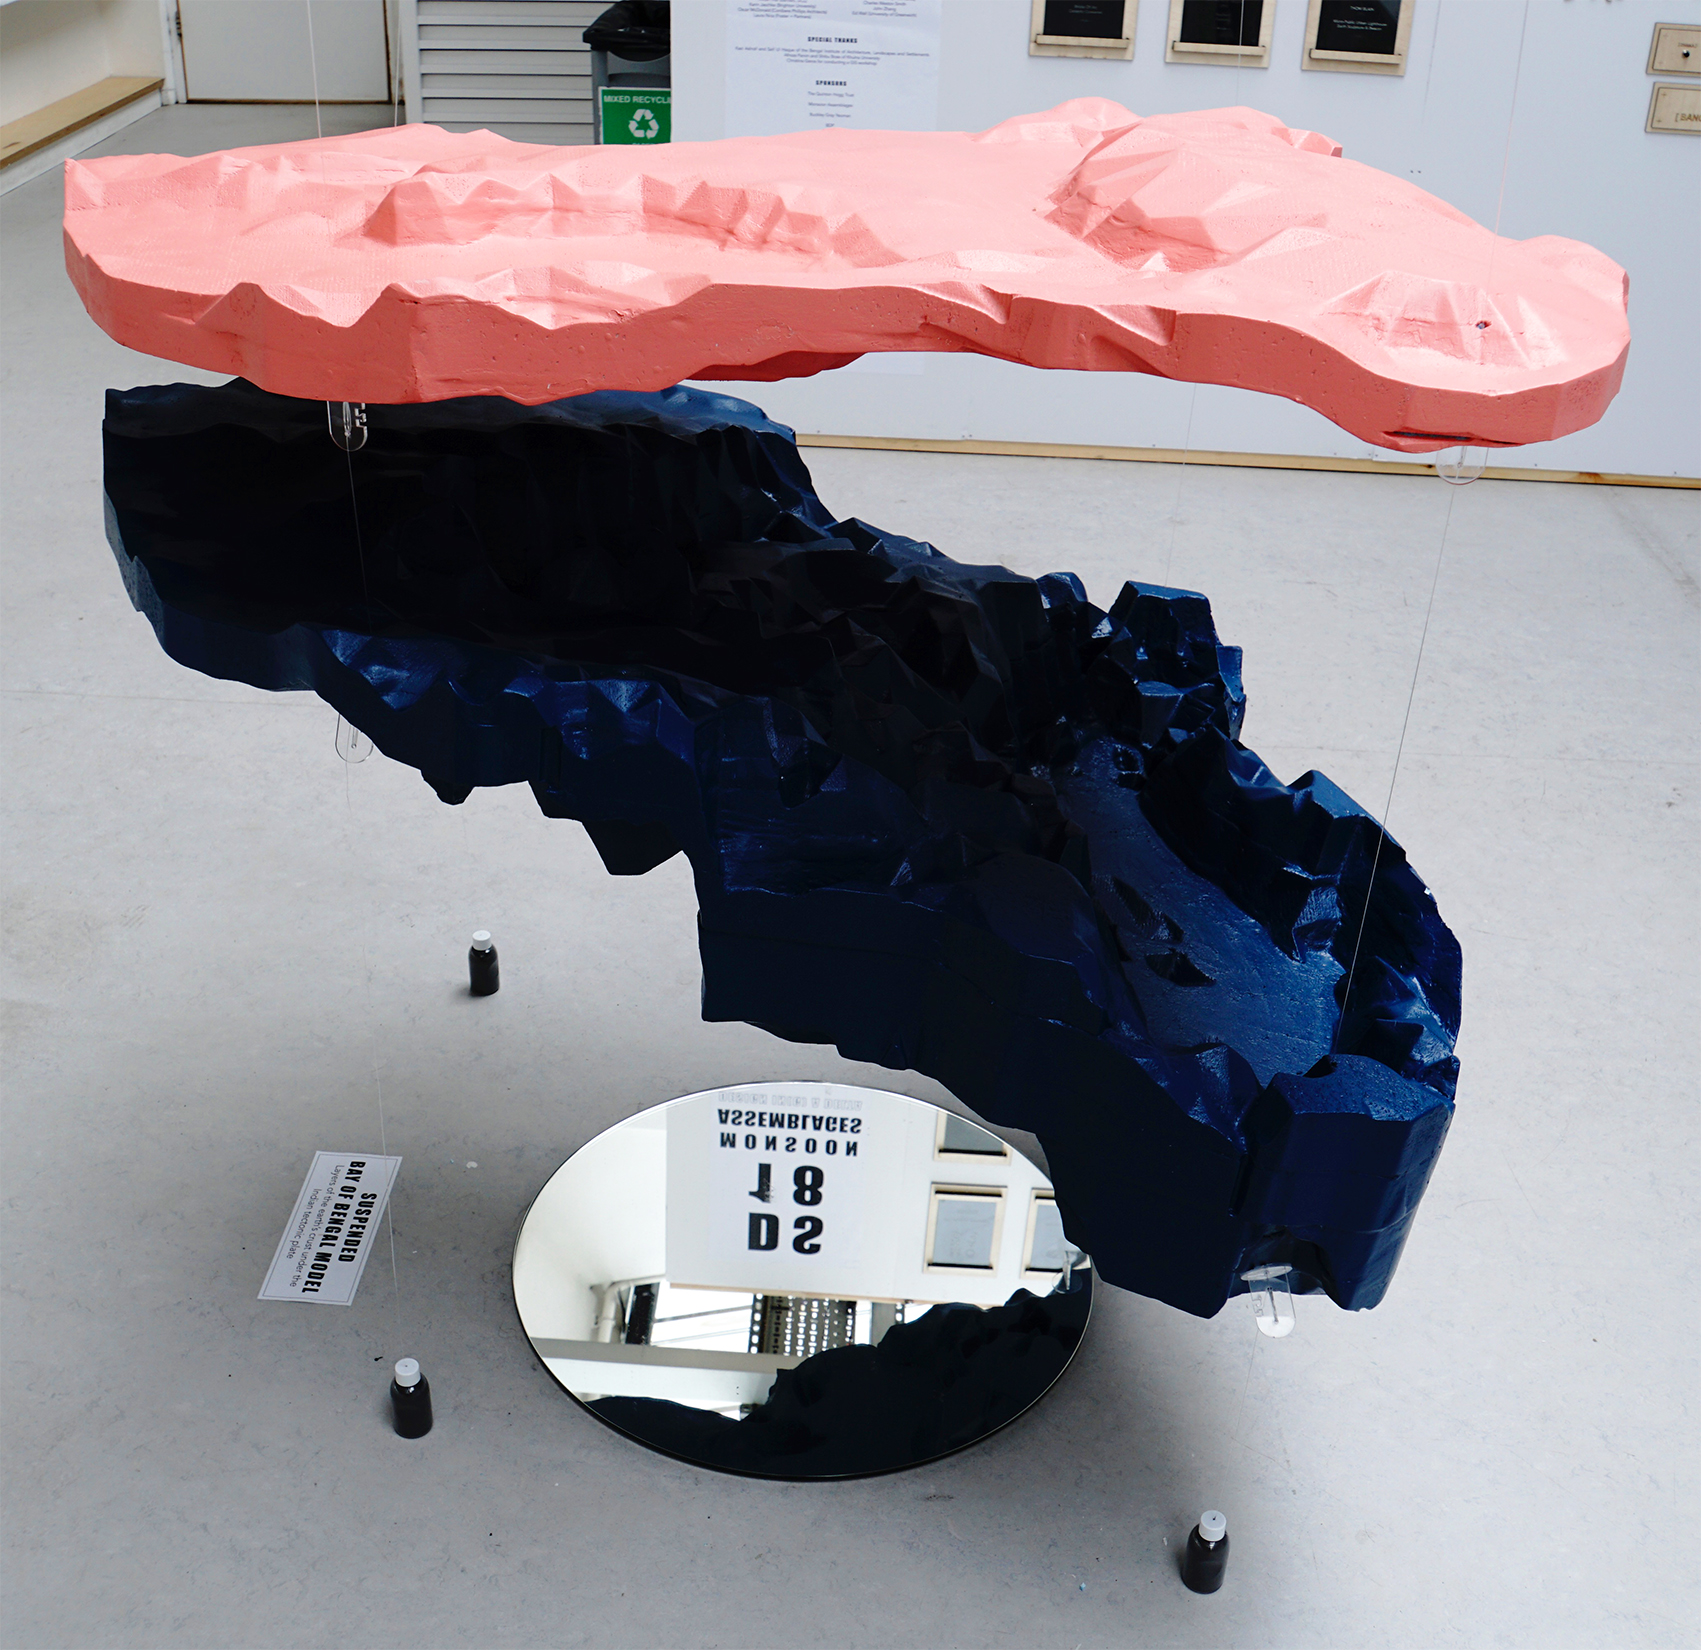
Image: Lindsay Bremner
The layers are held in place by four small bottles filled with metal filings suspended at the bottom of the fishing wire just above the floor. On the floor a circular mirror reflects the undersides of their surfaces. A sign, also on the floor, informs us that this is a model of two layers of the earth’s crust under the Bay of Bengal. A drawing on a nearby table gives more details, clarifying that these are two layers of the eight of the earth’s crust that make up the Indian Tectonic Plate.
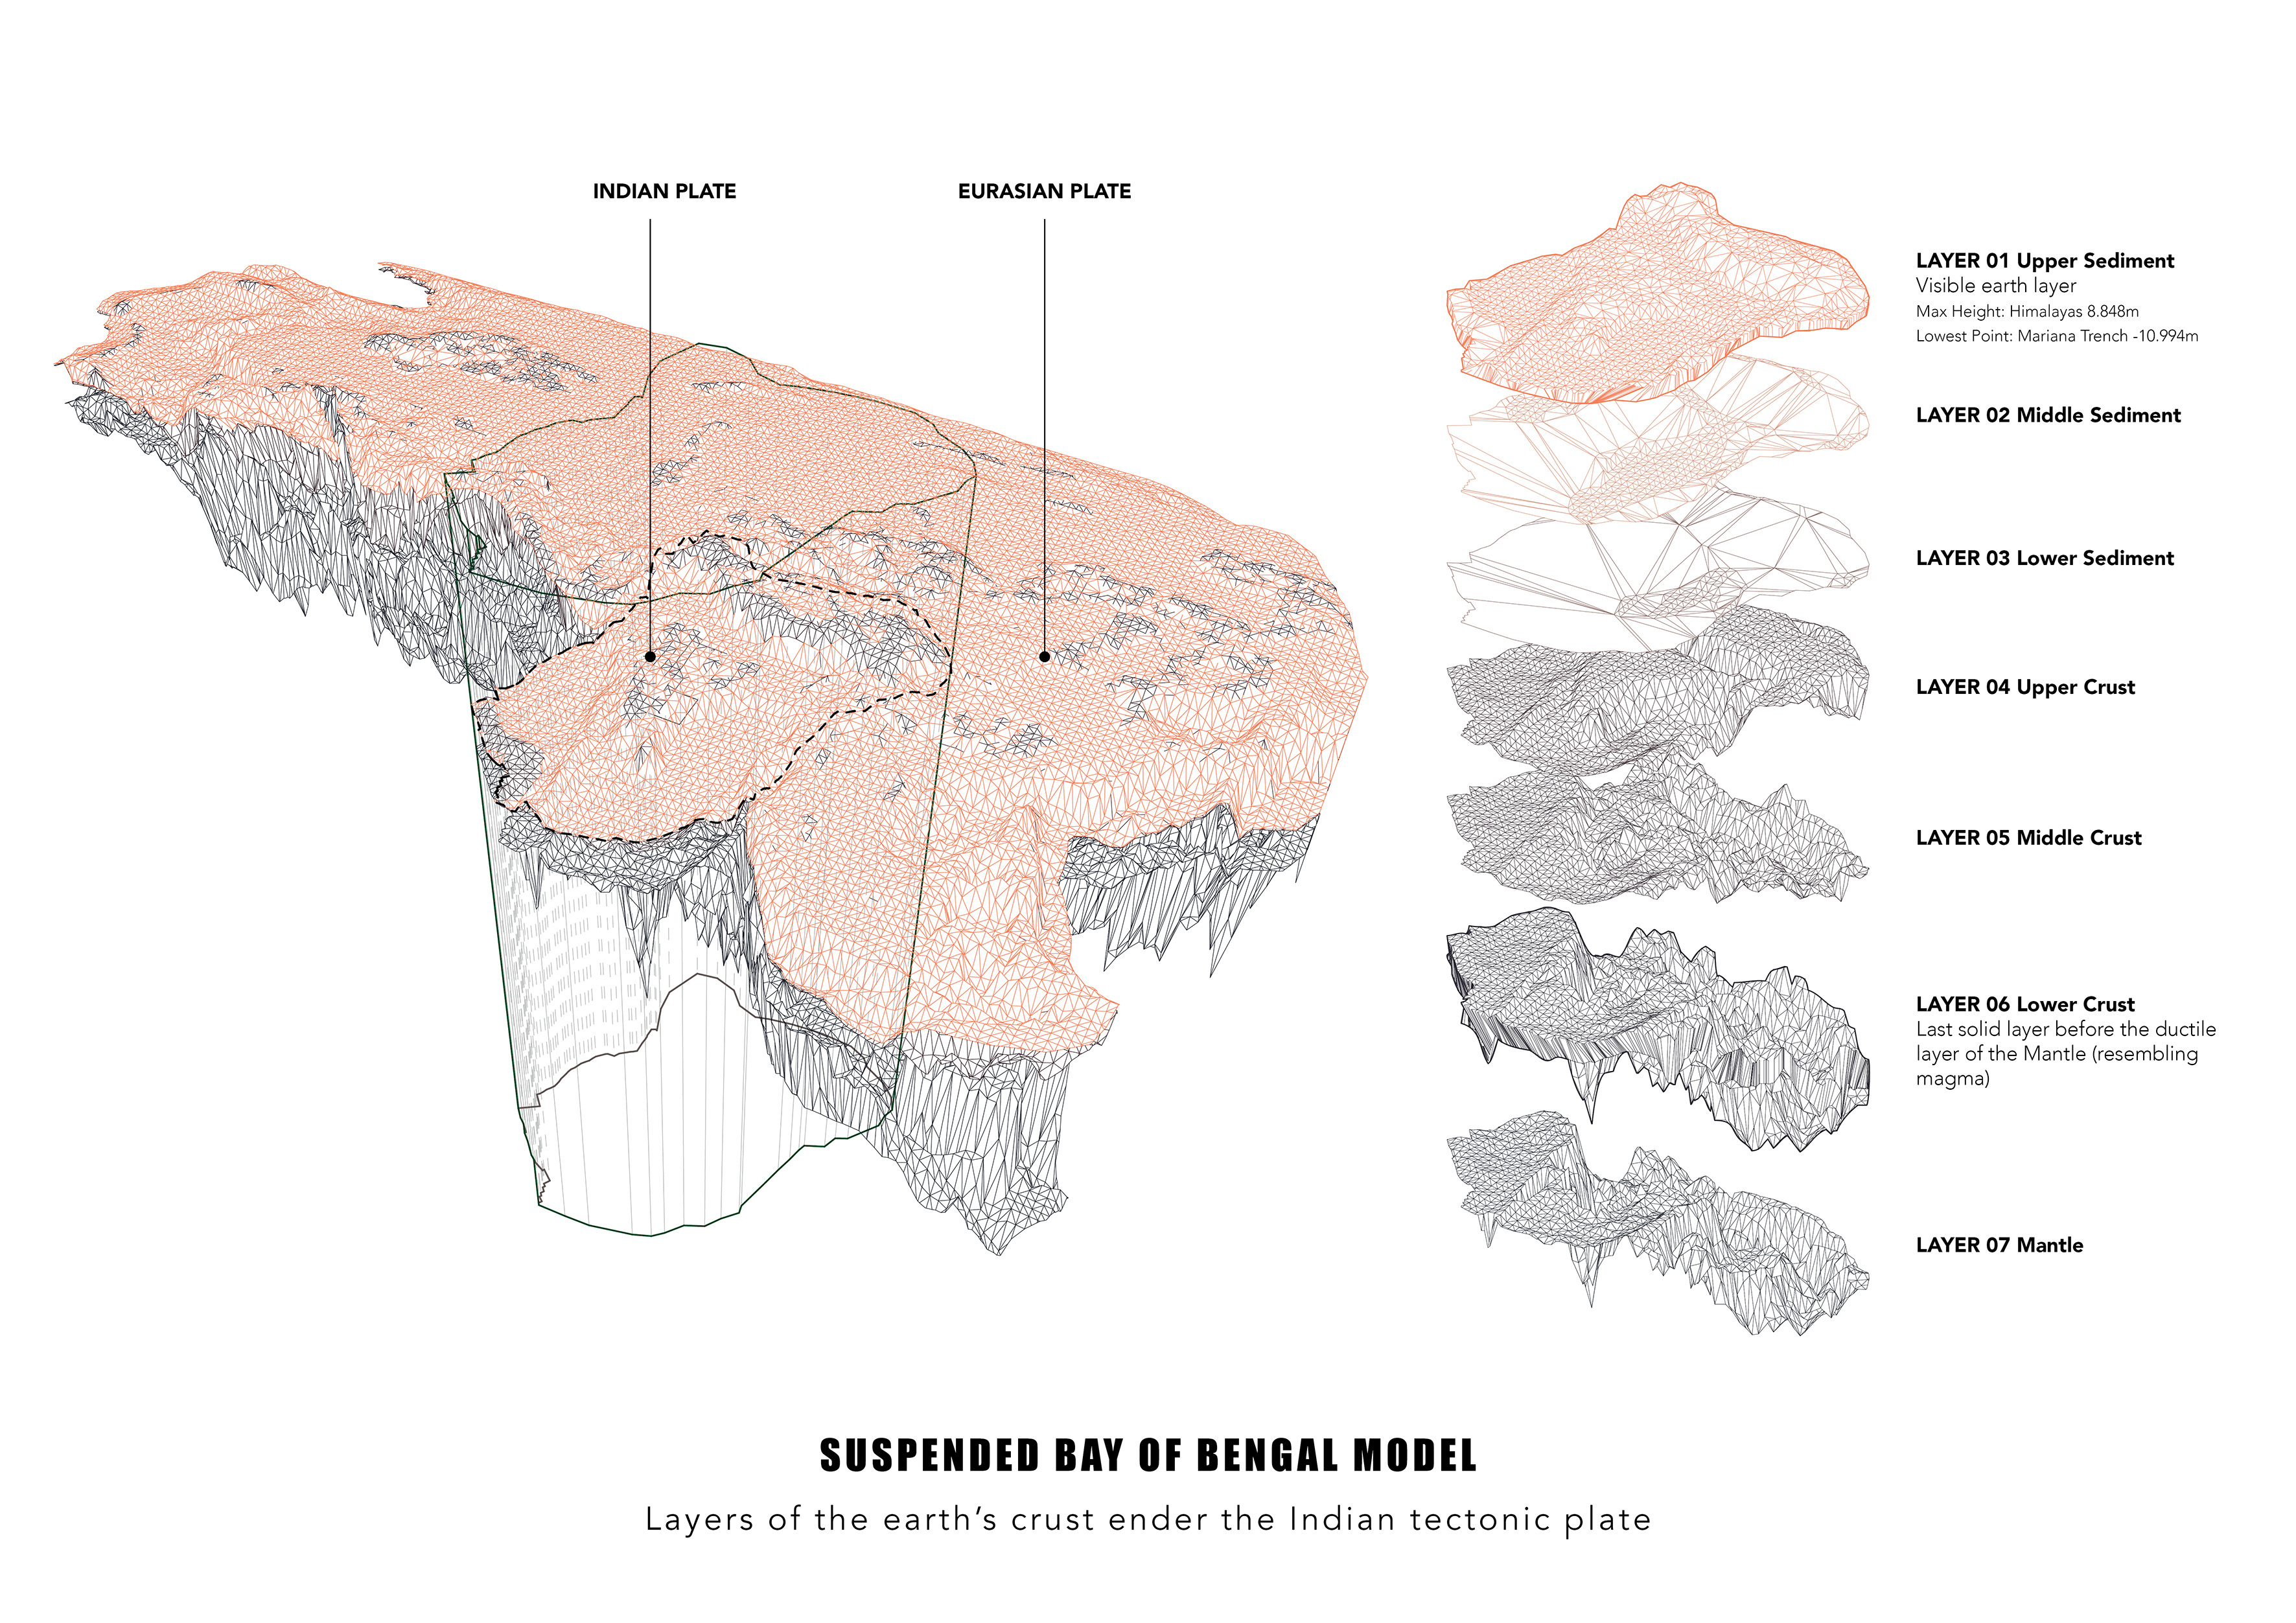
Drawing: Thomas Blain
This is a highly evocative object assemblage. It is neither accurate nor true, correlating in no way with what it claims to represent, yet giving a partial glimpse into what the inside of the earth’s crust might look like should we be able to see into it. As an object, it is rhetorical, inviting contemplation on the instability and fluidity of the stratified layers of the earth as we know it and reminding us of the precariousness of existence on it. This makes it a far more appropriate image of the earth at the time of the anthropocene than the unified view of the planet from outer space portrayed by NASA’s Blue Marble images.
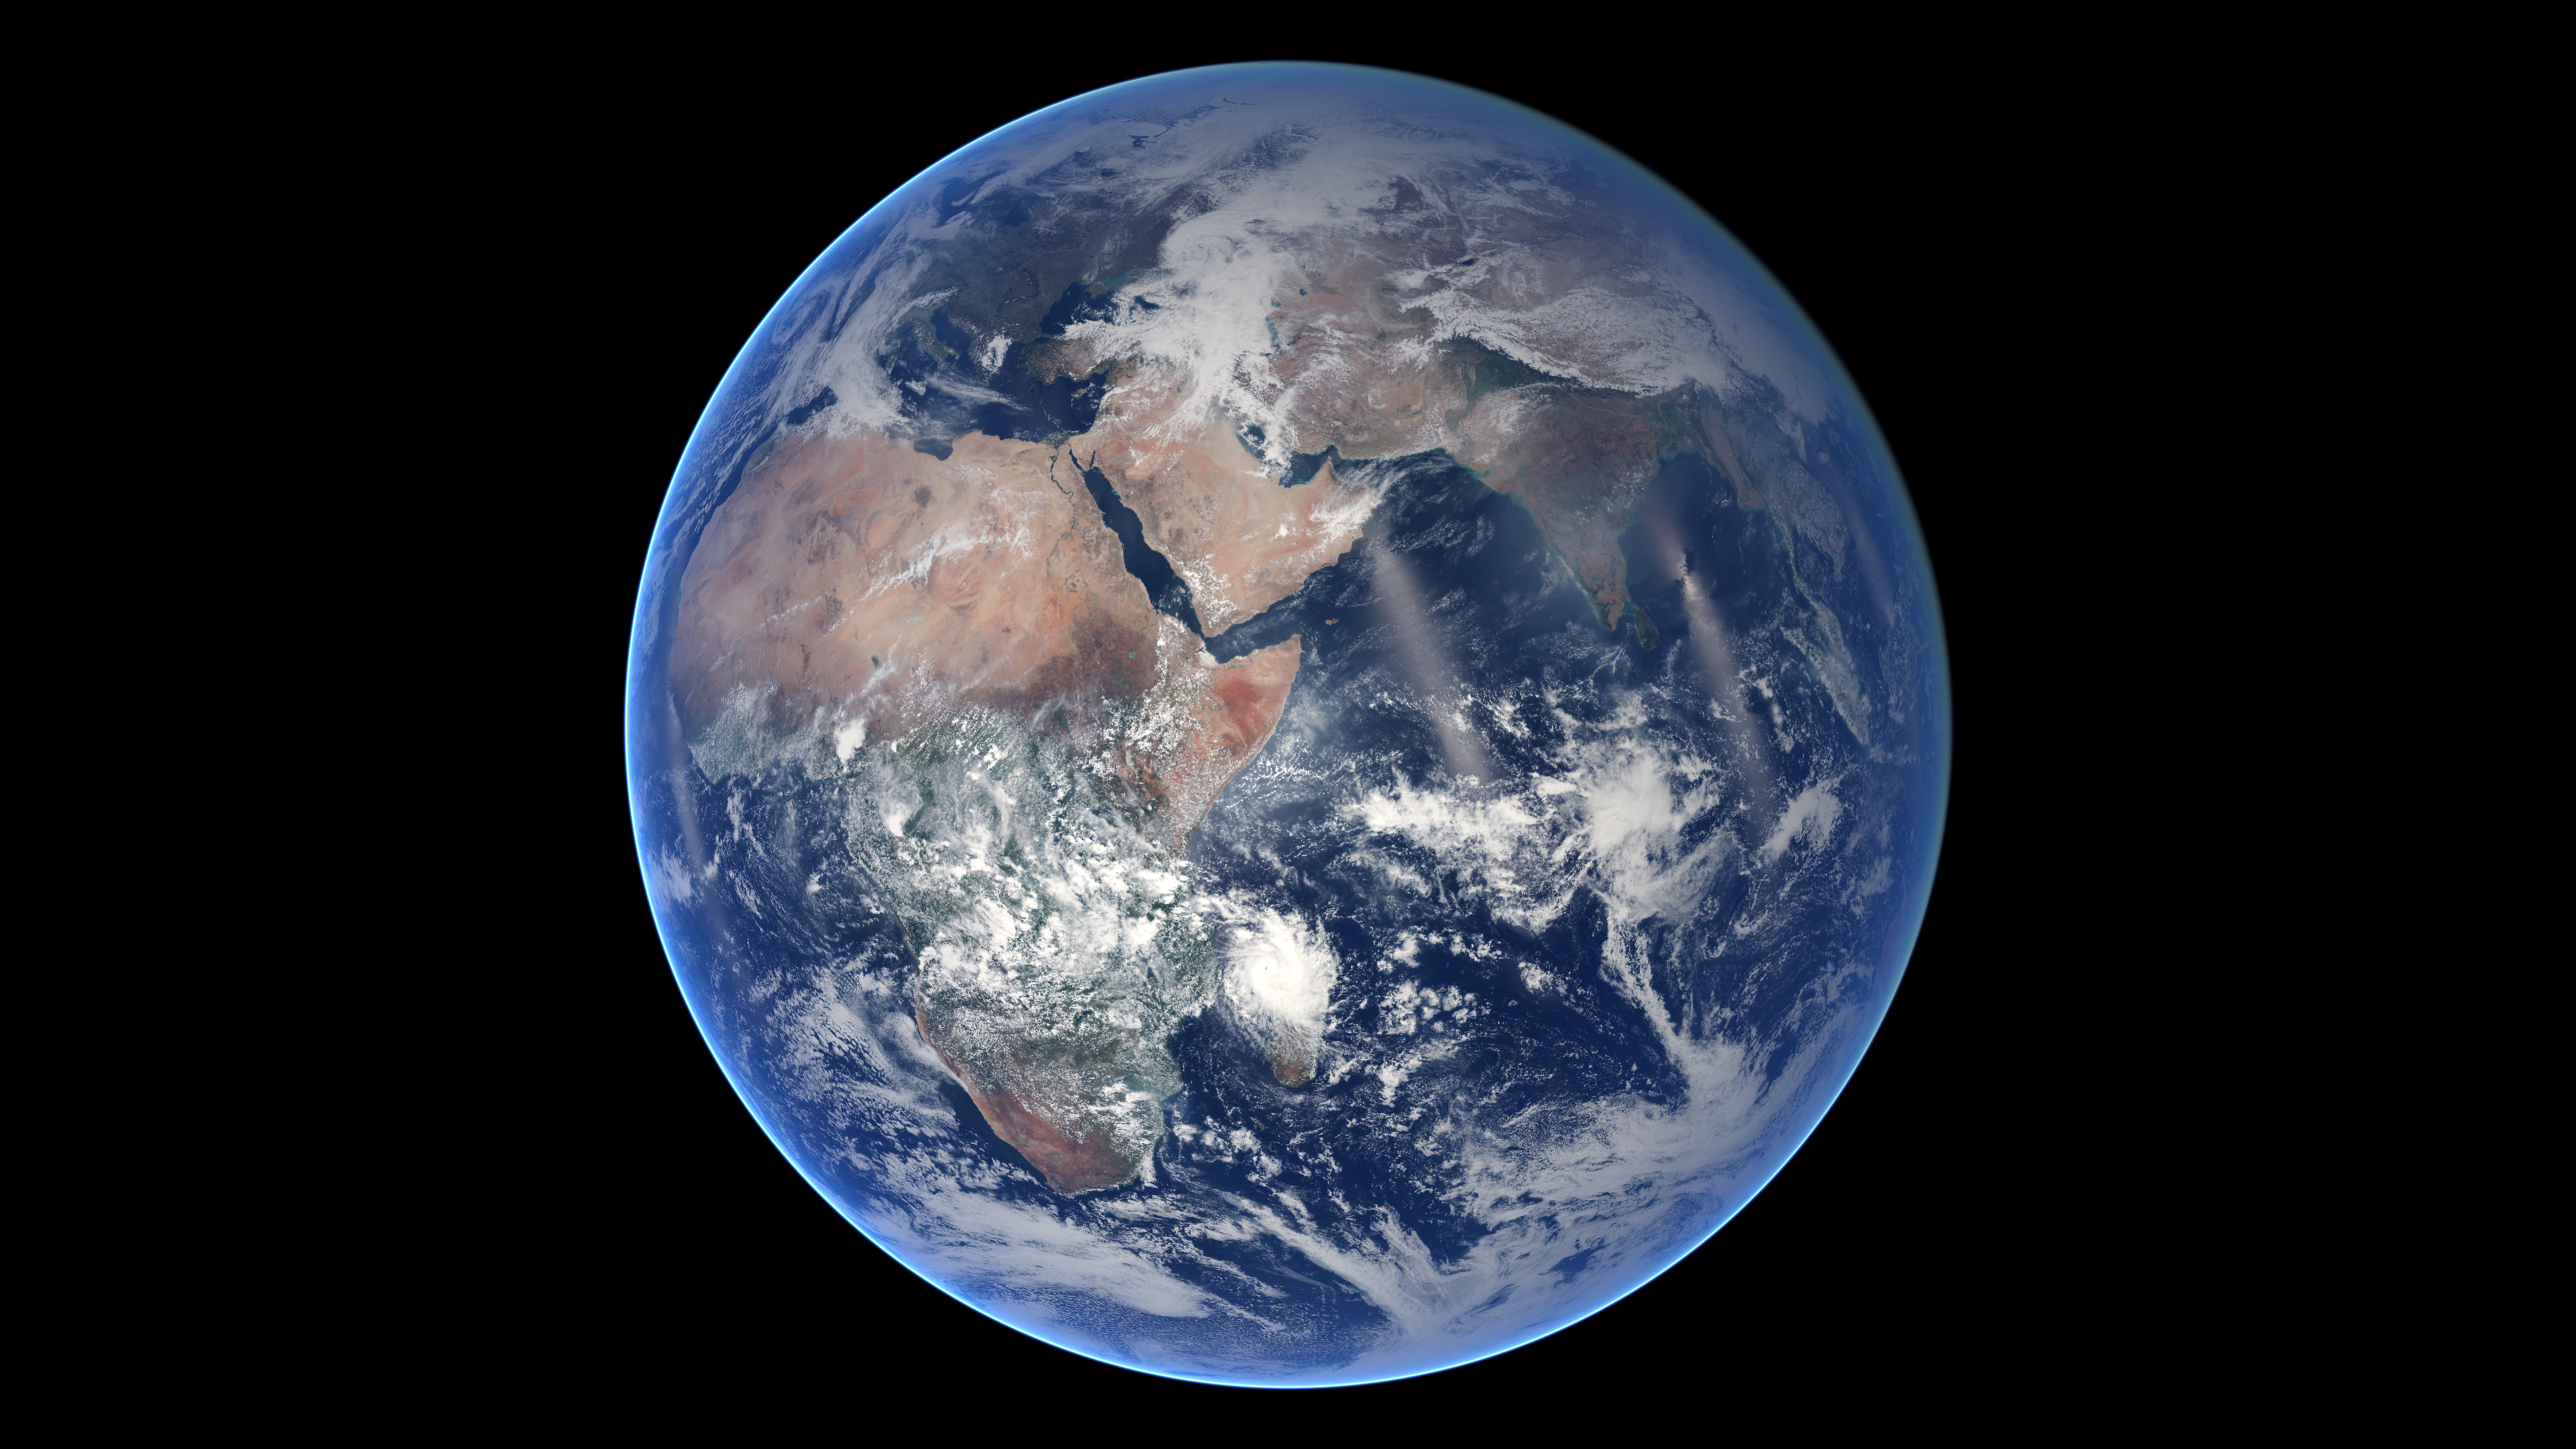
Blue Marble Eastern Hemisphere
August 21, 2014. Source: httpsearthobservatory.nasa.gov/IOTD/view.php?id=84214
Process:
The model was made from CRUST 1.0 (https://igppweb.ucsd.edu/~gabi/crust1.html) data, developed by earth scientists Gabi Laske, Zhitu Ma, Guy Masters and Michael Pasyanos, which assigns an eight-layer crustal profile (water, ice, upper sediments, middle sediments, lower sediments, upper crust, middle crust, lower crust) to each 1o x 1o cell of the earth’s surface.
To make the model, the data was downloaded from the website https://github.com/jrleeman/Crust1.0, which is already a reinterpretation of the original Crust 1.0 data applied onto the world globe via google earth. The data was exported as a kmz file into excel. They needed cleaning up as the only data we were interested in was the depth of the crust layers. We put together a formula to discard all the other data associated with each point (e.g. p wave velocity, density of material etc.), and were then able, through the use of grasshopper, to model each layer as a 3d surface and juxtaposed one on top of the other. We scaled longitude and latitude 1:1 and depth 100:1, following NASA conventions.
To create the hanging 3D model, data encompassing the Eurasian and Indian tectonic plates (between 40W and 150E longitude and 10S and 90N latitude) was isolated from other data in the excel spread sheet. A polyline representing the boundary of the Indian tectonic plate was created and extruded to cut through all the layers of the earth modelled. This boundary was slightly edited to incorporate the Himalayas, as it is one of the drivers of the monsoon and therefore central to the studio’s study. Some adjustment to fit the size of the modelling material (blue foam sheets of dimensions 1.2m x 1.2m x 50mm) was then required. The model was scaled up by a ratio of 24:1, and then down in the z-axis by 50% to avoid having a model of 2.4 m high. The two layers selected to be modelled (upper sediments and middle crust) were then split by surfaces at 50mm offset in the z-axis to conform to the maximum depth of blue foam that ‘Norman,’ the CNC machine in our fabrication laboratory is able to cut. All these manipulations were done in Rhino. After splitting each layer into 50mm deep sections, the pieces were arranged on a 1.2m x 1.2m template for cutting and Rhinocam was used to create the CNC machining paths. Each sheet had to be cut top and bottom to create the surface topologies. Once cut, the 50mm layers were glued, polyfilled, sanded and painted to create the finished layers, which were then hung on fishing line in the exhibition space.
Data sourcing, downloading and cleaning: Thomas Blain
Model preparation: Thomas Blain and Anett Bako
Model by Thomas Blain, Anett Bako and Lidia Gherghe in the Fabrication Lab London at the University of Westminster
The model is part of DS18’s contribution to the University of Westminster’s OPEN exhibition, on until 09 July 2018, 10.00 – 21.00 at 35 Marylebone Road, London NW1 5LS. For other images of the exhibition go here. The model is one of a series of prototypes that will be built over the coming months by the MONASS team to understand and visualise the Bay of Bengal as a geo-atmospheric region.